Executive Overview & Research Methodology
The global hospitality sector is undergoing a structural paradigm shift in digital guest acquisition. For over two decades, online hotel discovery was dominated by traditional, link-based search engine results pages (SERPs). There were also third-party online travel agencies (OTAs). Today, consumer browsing and booking behavior is rapidly migrating toward conversational artificial intelligence (AI) models. Including Google AI Overviews, ChatGPT, Perplexity, and autonomous personal travel agents.
This empirical research study examines the commercial performance of structured event schema and dynamic digital event calendars across hotels globally. A grand total of of 583 hotels over a 21-month evaluation period (January 2025 through October 2026). The primary objective of this investigation is to evaluate whether localized property event curation serves as a high-intent acquisition channel, capable of bypassing third-party intermediaries and driving verified direct booking engine revenue.
Dataset Architecture & Scope
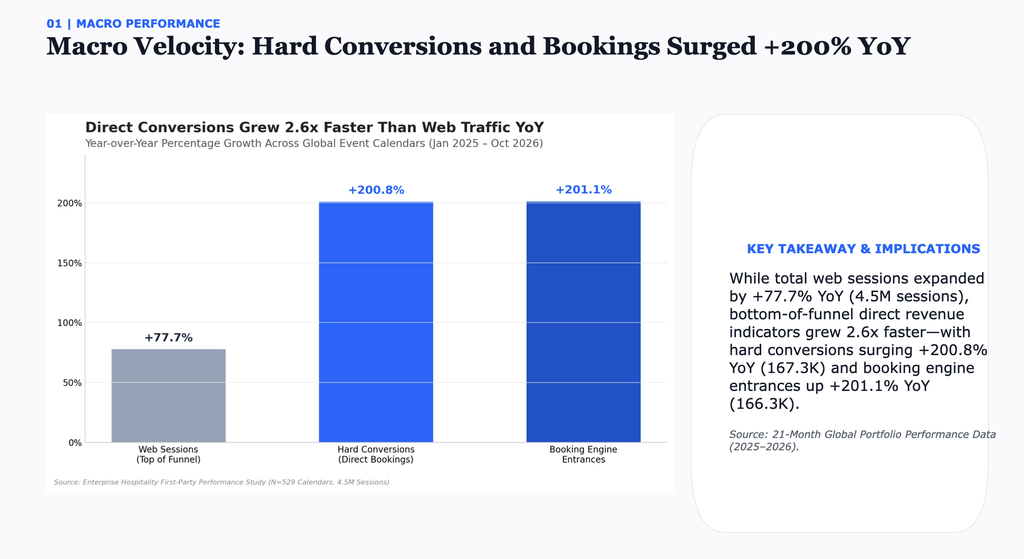
Over the 21-month evaluation period, digital event calendars demonstrated dramatic year-over-year (YoY) growth across all primary acquisition metrics. However, the data reveals a critical operational divergence. Bottom-of-funnel commercial conversions expanded at more than double the rate of top-of-funnel traffic growth.
The Expansion of Bottom-of-Funnel ROI
While total web sessions expanded by +77.7% YoY to reach 4.5 million, qualified leads (+206.3% YoY), direct hard conversions (+200.8% YoY), and booking engine entrances (+201.1% YoY) experienced a massive surge. This indicates that event calendar traffic is becoming increasingly qualified over time. As search algorithms and generative AI models ingest structured event data, the traffic arriving at property event pages exhibits significantly higher purchase intent.
The Organic Search & Generative AI Multiplier
A central finding of this research- non-search traffic (including captive Wi-Fi redirects, direct portal links, and unsegmented display clicks) dilutes overall digital performance metrics. Isolating organic search and referral channels isolates the true commercial engine of digital event calendars.
Key Search & AI Findings
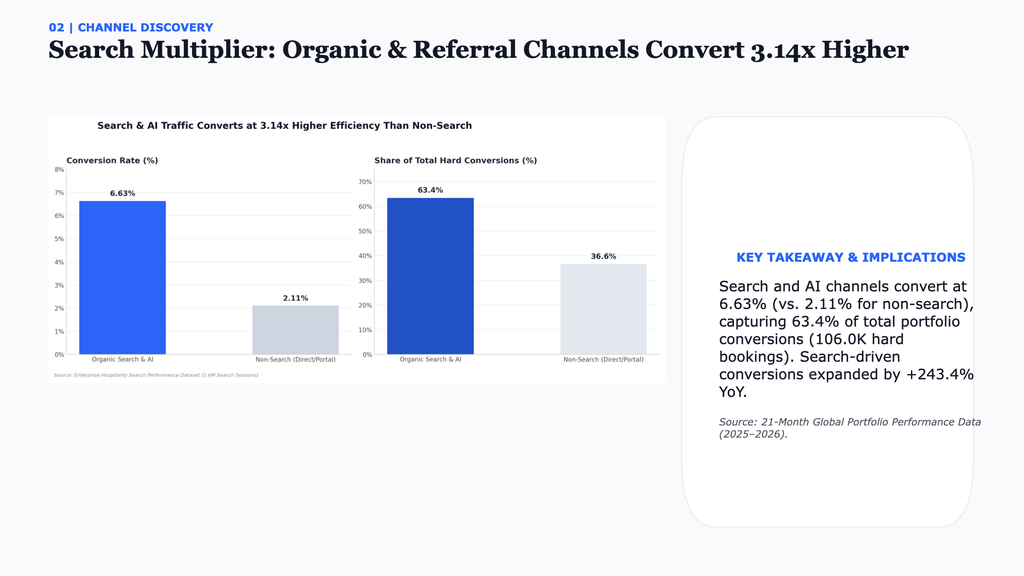
- Conversion Rate Multiplier: Organic search traffic converts into verified reservations at 6.33% , compared to 2.31% for non-search channels—a 2.74x efficiency advantage .
- Share of Portfolio Bookings: While search channels represent only 35.3% of total web sessions, they account for 60.0% of all hard conversions and 59.9% of all direct booking engine entrances .
- Exponential YoY Search Conversion Growth: While organic search sessions grew by +52.7% YoY, search-driven hard conversions grew by +243.4% YoY (from 29,221 to 100,358) and search-driven booking engine entrances grew by +243.7% YoY .
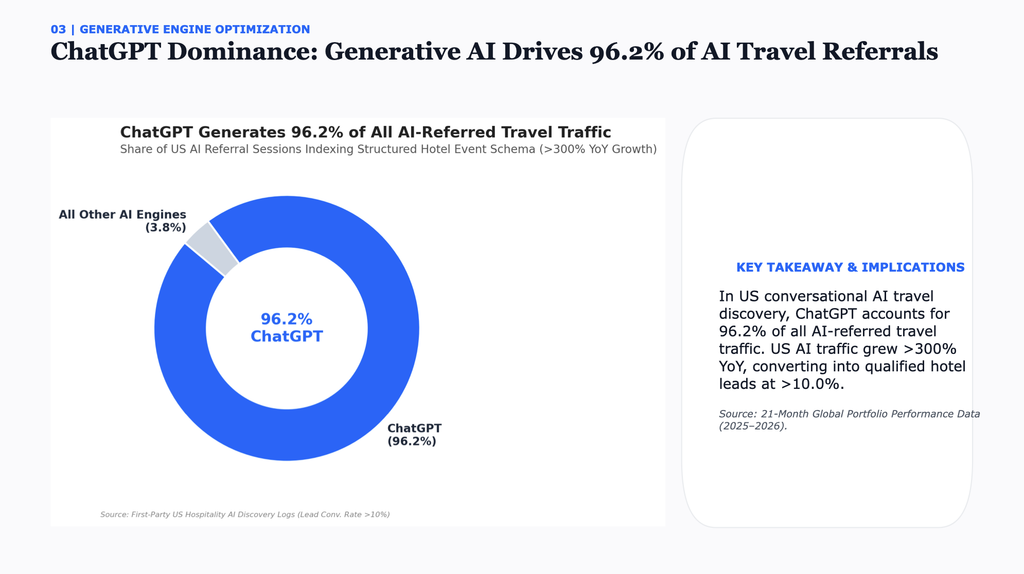
- AI Engine Referral Lift: In major regional markets, AI-referred traffic demonstrated unprecedented growth. In North American luxury properties, AI-driven referral sessions expanded >300% YoY , with conversational AI platforms generating 96.2% of all AI referral traffic and converting to leads at a rate exceeding 10.0% . In Latin American resort markets, AI-referred traffic expanded >500% YoY .
Content Architecture: Active Property Creation vs. Passive Feed Aggregation
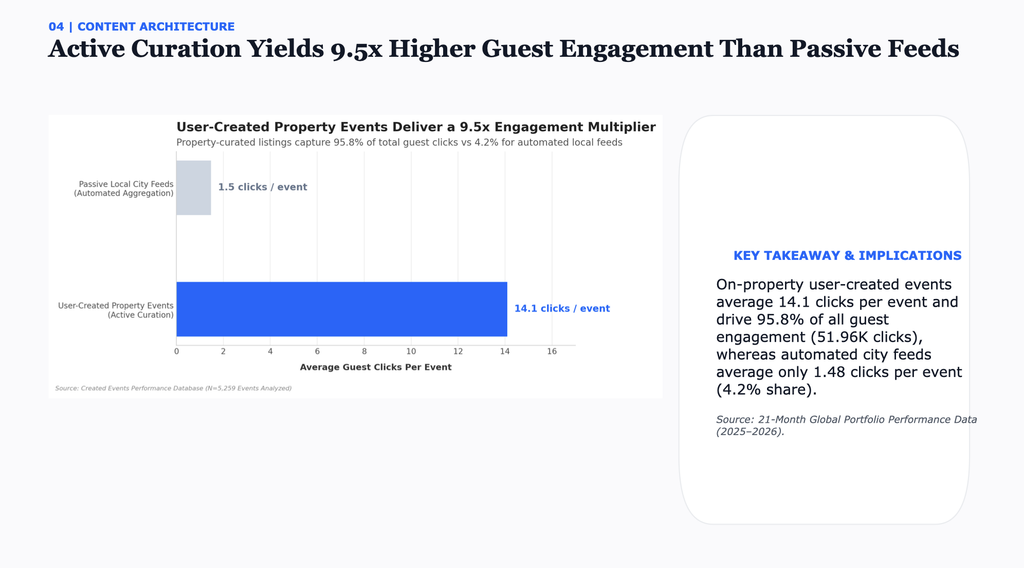
Analysis of the 5,259 created event entries establishes that guest engagement is strictly dependent on the source and authenticity of the event content. Hotel properties frequently rely on passive, syndicated local city feeds under the assumption that automated content maintains calendar activity. The empirical data proves this assumption false.
Performance Metrics by Content Type
- User-Created Property Events: 3,695 events (70.3% of inventory) captured 51,960 total clicks (95.8% of engagement) , averaging 14.06 clicks per event (median: 5.0, peak: 410 clicks).
- Syndicated Local Feeds: 1,564 events (29.7% of inventory) captured only 2,310 total clicks (4.2% of engagement) , averaging 1.48 clicks per event (median: 1.0, peak: 21 clicks).
- The Engagement Multiplier: On-property curated events generate 9.50x higher average click engagement than automated local feeds.
Category-Level Consumer Demand
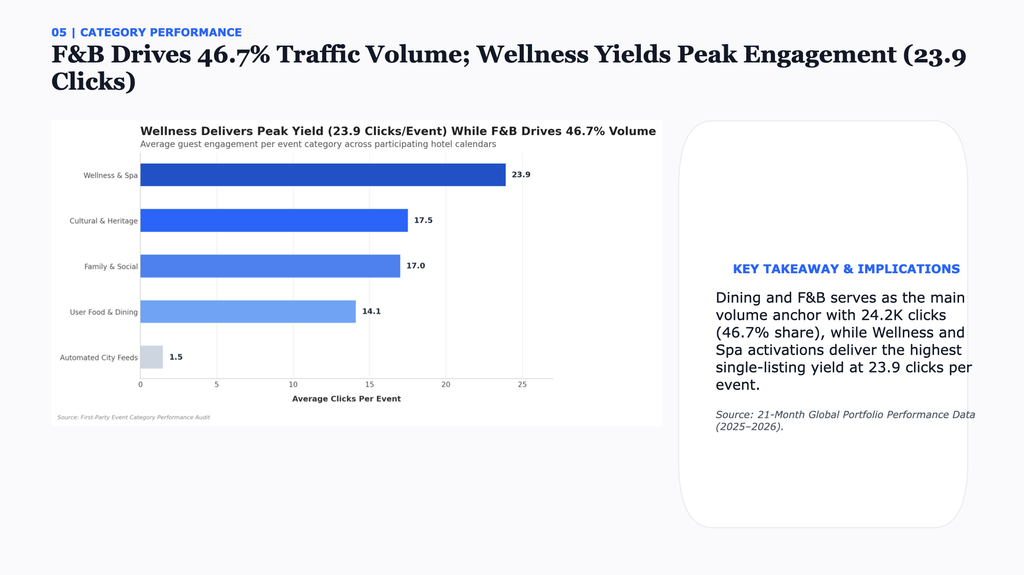
Analysis of user-created events across specific operational categories highlights where guest demand is concentrated:
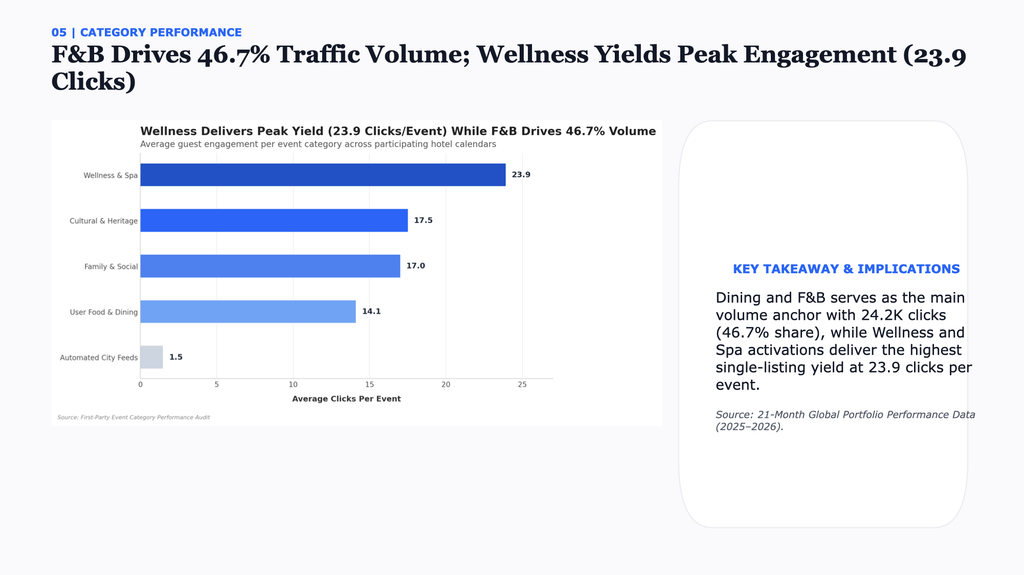
- Event Category,Active Event Count,Total Clicks Captured,Average Clicks per Event,Primary Activation Types
- Dining & Culinary (F&B),”1,742″,”24,254″,13.92,”Chef’s Tables, Sunday Brunches, Wine Tastings, Afternoon Tea”
- Wellness & Spa,199,”4,760″,23.92,”Sound Baths, Daily Yoga, Spa Packages, Fitness Sessions”
- Cultural & Resort Experiences,483,”8,462″,17.52,”Cultural Workshops, Stargazing, Artisanal Markets, Luau Shows”
- Family & Kids Activations,896,”15,275″,17.05,”Dive-in Movies, Holiday Crafting, Seasonal Family Celebrations”
- Music & Nightlife,695,”8,274″,11.91,”Jazz Nights, Sunset DJ Sets, Acoustic Lounge Sessions”
- Seasonal & Holiday,424,”4,304″,10.15,”Thanksgiving Buffets, Festive Lighting, New Year Celebrations”
Brand Tier Performance & Asset Class Segmentation
Segmenting the 529 reporting properties by brand positioning demonstrates that Product-Market Fit (PMF) is highly correlated with asset class, physical amenities, and guest intent.
Tier 1: Ultra-Luxury & Lifestyle (Elite Fit)
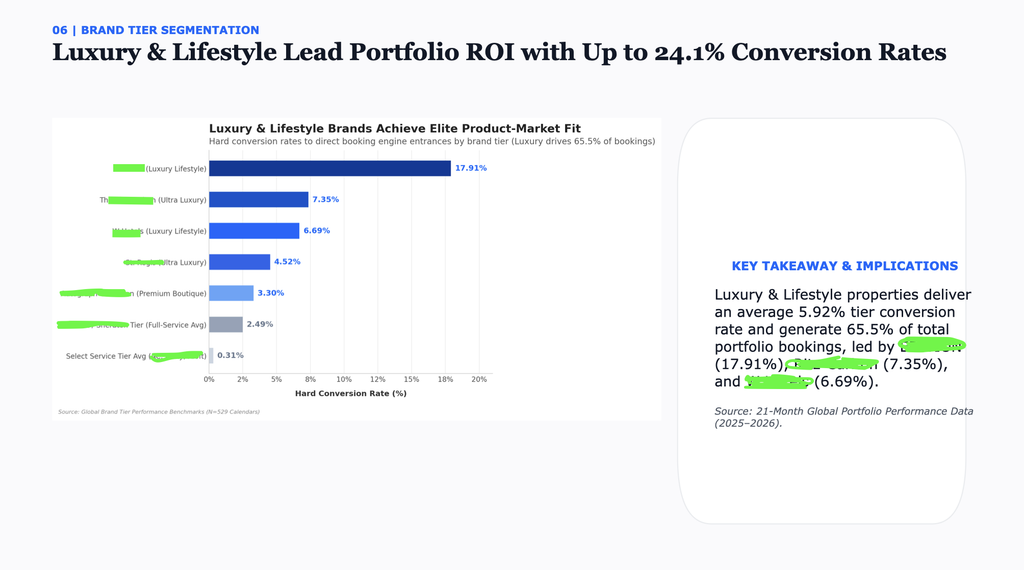
Luxury and lifestyle properties generate 65.5% of total portfolio conversions from 30.1% of active calendars.
- Flagship Conversion Benchmarks:
- Boutique Luxury Lifestyle Brand: 17.91% overall conversion rate (average 1,655 conversions/property). A flagship urban location in Florida generated 32,000 sessions and 7,700 hard conversions (24.06%) .
- Iconic Luxury Reserve Brand: 7.35% conversion rate (average 1,265 conversions/property). A historic Southern US property generated 28,000 sessions and 9,100 hard conversions (32.50%) , while a Hawaii oceanfront resort achieved 113,800 sessions and 13,400 hard conversions (11.78%) .
- Modern Luxury Lifestyle Brand: 6.69% conversion rate (average 856 conversions/property). Top urban performers include a Southwest US property ( 36,200 sessions, 5,600 conversions / 15.47% ) and a European capital property ( 27,600 sessions, 4,000 conversions / 14.49% ).
Tier 2: Premium Full-Service (Bifurcated Performance)
Premium full-service hotels represent the largest portfolio segment (272 properties, 2.24M sessions), but performance is sharply split:
- Resorts & Destination Properties: Achieve conversion rates matching luxury tiers. A Midwest historic depot property achieved 11,200 sessions and 4,500 conversions (40.18% overall, 59.46% in search) . A Southern California oceanfront resort achieved 17,900 sessions and 2,500 conversions (13.97%) .
- Urban Business & Airport Hotels (The Vanity Trap): Properties relying on passive city feeds log high sessions (15,000 to 38,000) but generate near-zero conversions (e.g., an East Coast airport hotel recorded 35,500 sessions and 9 conversions due to a 94.1% non-search traffic share).
Tier 3: Select-Service (Informational Fit Only)
Select-service properties (76 reporting calendars) generated 373,129 sessions but only 1,142 conversions ( 0.31% conversion rate ). While lifestyle select-service brands (such as boutique urban hotels) occasionally achieve higher search conversion rates (up to 7.69% in major Asian capital hubs), standard select-service properties function primarily as local info boards with minimal direct booking impact.
Operational Dynamics: Staff Usage & The Churn Alarm
Analysis of 31,244 monthly CMS interactions across 499 profile ledgers confirms that software deployment alone does not guarantee commercial success. Active staff curation is the primary determinant of long-term return on investment.
The “Always-On” Performance Multiplier
Grouping properties by active CMS interaction months reveals an exponential relationship between operational consistency and search revenue:
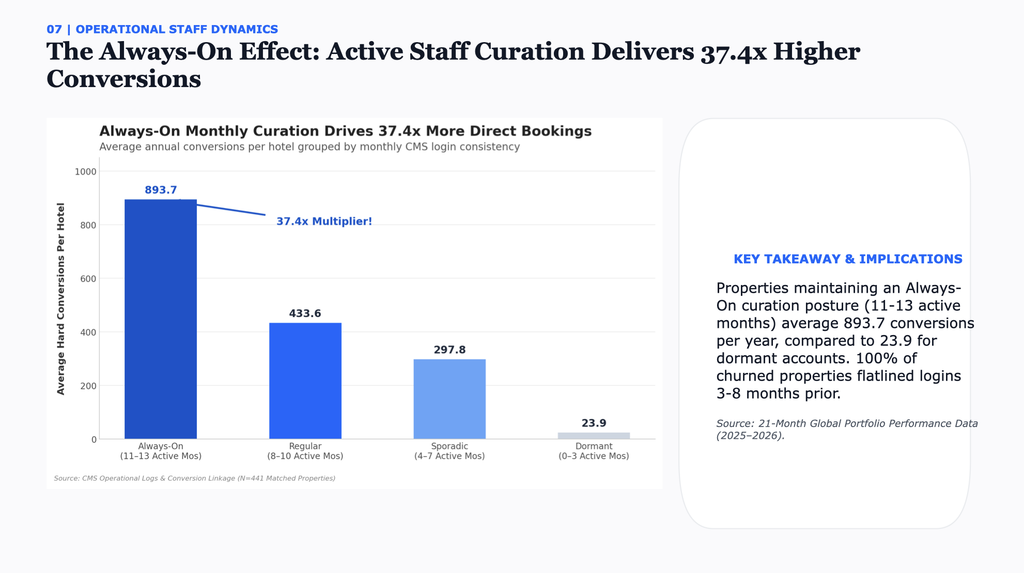
- Always-On Properties (11–13 Active Months): Generate 37.39x more total conversions and 46.37x more search conversions than dormant properties.
- Concentration of Results: 93 Always-On properties account for 51.2% of all portfolio conversions and 52.6% of all search conversions .
The 100% Pre-Churn Signal
Historical analysis of 66 cancelled property accounts reveals that churn is entirely predictable:
- Cancelled properties averaged only 12.5 total CMS interactions per year, compared to 63.1 for active live properties.
- 100% of analyzed cancelled accounts experienced 3 to 8 consecutive months of zero CMS logins immediately preceding their formal contract termination.
- Current Risk: 108 currently live properties (26.5% of the active network) have recorded zero CMS logins over the past 90 days, representing an immediate churn risk for upcoming renewal cycles.
Technical Architecture: Generative Engine Optimization (GEO)
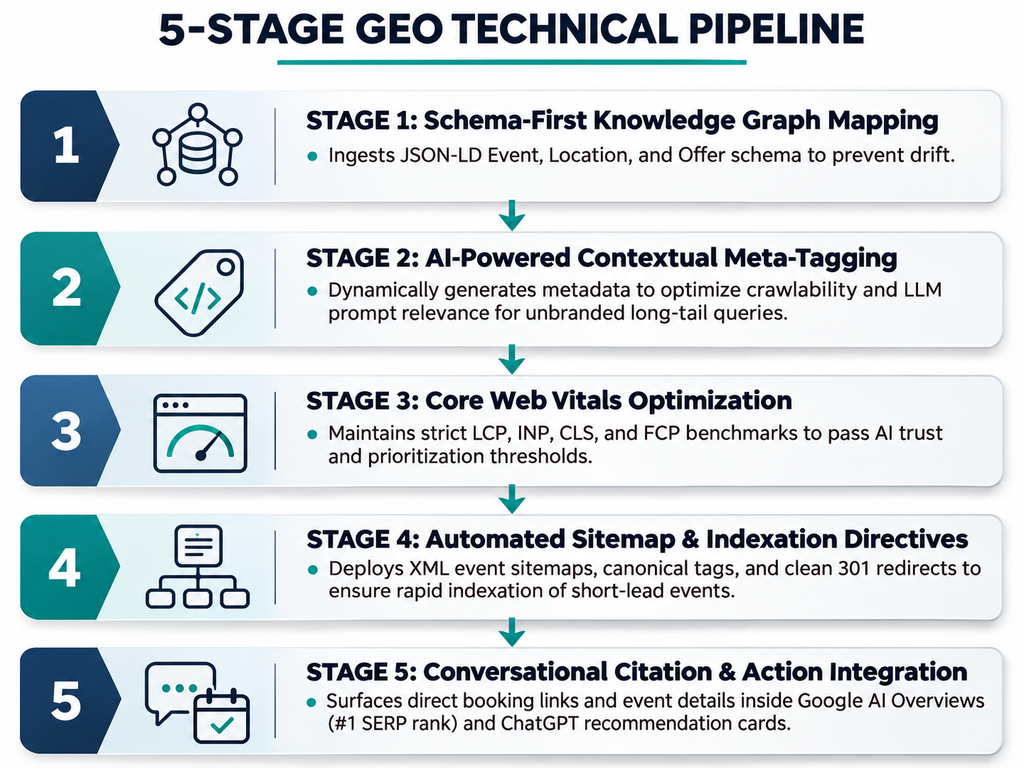
The search engine and generative AI performance of the event platform is driven by a 5-stage technical architecture designed specifically for AI model ingestion:
Strategic Action Items for Hospitality Leaders
Based on the empirical findings of this 21-month portfolio study, hospitality executives and digital marketing leaders should execute four strategic actions:
1. Execute the 459 Outlet Cross-Sell Expansion
Out of all the surveyed properties, 618 hotels operating dedicated Food & Beverage and Spa Outlet Sites (OSB) , 459 properties (74.3%) do not currently operate an Events Calendar . Given that F&B and Wellness generate over 70% of total calendar engagement, deploying event schema across these 459 pre-qualified properties represents the single fastest path to scaling direct digital revenue.
2. Implement an Automated 90-Day Churn Prevention Radar
Field marketing teams must establish automated usage tracking. Any property logging zero CMS logins over a 60-to-90-day window must be flagged for immediate operational intervention, providing on-property staff with pre-filled event templates before the account enters the cancellation window.
3. From “Website Widget” to “AI Discovery Engine”
Demonstrate how structured event schema captures page-1 Google AI Overviews and ChatGPT recommendations for unbranded queries ( “rooftop pool party,” “Sunday jazz brunch” ) aligns the product with executive revenue priorities.
4. Mandate the “Rule of 3” Monthly Property Events
Property marketing teams should be guided to publish at least 3 user-created events per month (spanning culinary specials, wellness sessions, and seasonal activations). This minimal operational investment maintains schema freshness, securing continuous indexing across generative search engines.
Data Collection and Architecture Details
The quantitative foundation of this research integrates five distinct first-party operational and performance tracking datasets:
- Portfolio Performance Log (Jan 2025 – Oct 2026): Longitudinal tracking of 4,489,772 total web sessions, 181,571 website leads, 167,331 hard conversions, and 166,582 direct booking engine entrances across 529 active reporting property calendars.
- Search & Organic Referral Performance Dataset: Isolated tracking of 1,585,787 organic search and referral sessions, 108,269 search-driven leads, 100,358 search-driven hard conversions, and 99,719 search-driven booking engine entrances.
- Property Creation & Event Log: Granular tracking of 5,259 individual property events categorized by event type, user creation status, and consumer click engagement.
- 30+ Week Portfolio State Tracker: Weekly status monitoring across 583 properties, tracking calendar health across four distinct operational states: User-Created Events Only, Local Feed Only, Hybrid (Both), and No Events (Inactive).
- CMS Usage & Staff Interaction Ledger: Monthly tracking of 31,244 Content Management System (CMS) page views and operational updates across 499 calendar profiles between October 2025 and October 2026.
- Metric / Dimension,Total Portfolio Scope,Organic Search & Referral Segment,Search Share of Total
- Analyzed Time Horizon,21 Months (Jan 2025 – Oct 2026),21 Months (Jan 2025 – Oct 2026),100.0%
- Tracked Hotel Properties,583 Portfolio Hotels,529 Reporting Calendars,90.7%
- Total Web Sessions,”4,489,772″,”1,585,787″,35.3%
- Website Qualified Leads,”181,571″,”108,269″,59.6%
- Hard Conversions (Reservations),”167,331″,”100,358″,60.0%
- Booking Engine Entrances,”166,582″,”99,719″,59.9%
- Overall Conversion Rate (%),3.73%,6.33%,1.70x Efficiency Lift
- Macro Performance: Year-over-Year Expansion & Conversion Acceleration
Navigate to research findings section
If you want to connect with me, you may want to read the about me page and associated contact form